Building and Sharing Actionable Aerial Reports from Drone Data
@overheadinsights
Understanding Your Stakeholders' Needs Before You Start
Before you process a single image, pause to consider who will use the final report. A project manager, a municipal planner, and an insurance adjuster each want different information from the same aerial data. The project manager cares about progress and timelines. The planner needs accurate measurements and annotations. The adjuster wants clear visual evidence of conditions. Knowing this upfront saves rework. Ask yourself: what decisions will each stakeholder make from this report? The answer shapes your entire processing workflow.
When you collect drone data, you capture raw material. That material becomes useful only after you organize, measure, and annotate it. A shareable report is not just a collection of images. It is a structured document that answers specific questions. Think of it as a story told through maps, measurements, and highlights. The best reports let a viewer understand the situation without needing to ask follow-up questions. They are self-contained and intuitive.
Step One: Organize and Clean Your Raw Data
Start by downloading all your files from the drone's memory card into a single project folder. Use a consistent naming convention. For example, include the date, location, and flight number in each filename. This simple habit saves hours later. Delete duplicate images and discard any frames that are blurry or poorly exposed. If you flew a mapping mission, check that your image overlap percentages meet the processing software's minimum requirements. Most photogrammetry tools need at least 70 percent front overlap and 60 percent side overlap to produce accurate orthomosaics and elevation models.
During this step, also log any issues you noticed during the flight. Did the drone lose GPS signal in a certain area? Was there glare on a water body? Noting these problems now helps you explain anomalies in the final report. Your stakeholders will appreciate the honesty, and it builds trust in your data.
Step Two: Process the Data into Usable Layers
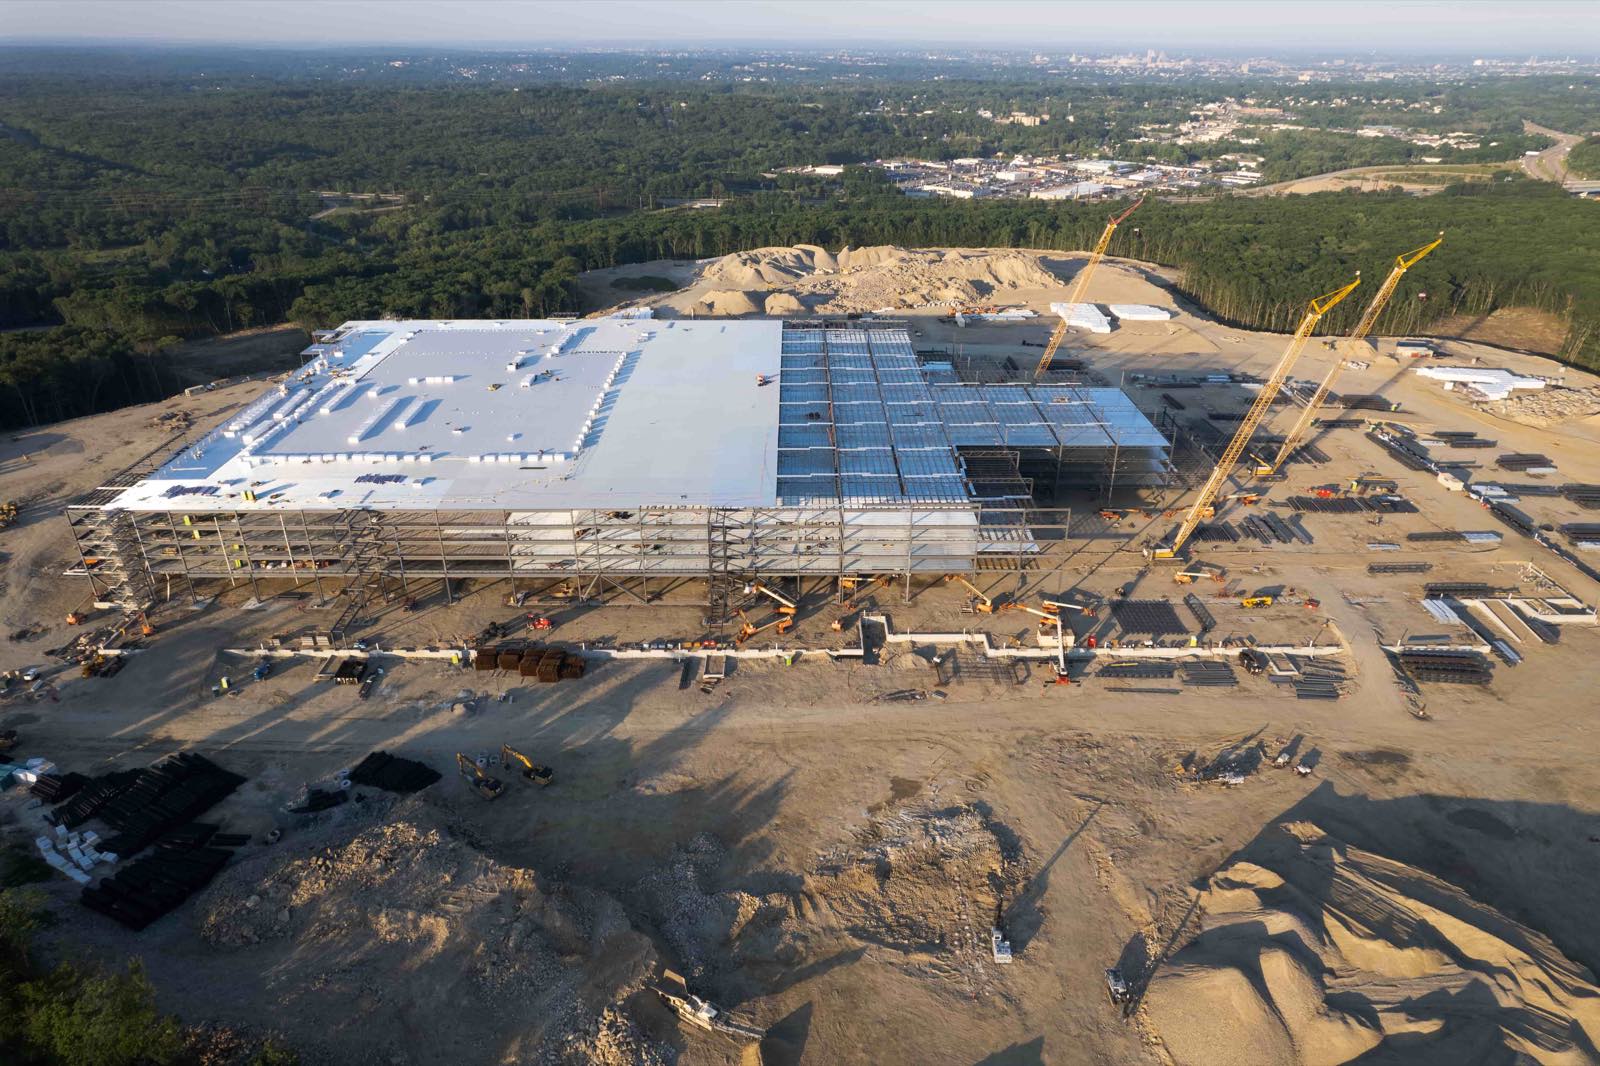
Upload your organized images into a processing platform. Many tools can align images, stitch them into orthomosaics, and generate digital elevation models. The platform you choose should handle georeferencing automatically. Georeferencing assigns real-world coordinates to every pixel, which allows accurate measurement. Without it, your report is just a pretty picture. Check the processing output for alignment errors. Look for seams between image strips where the ground may appear misaligned. Most software lets you reprocess with adjusted settings if the first pass is not clean.
Once you have a clean orthomosaic and elevation model, consider what additional layers your stakeholders need. For construction sites, a contour map or a cut-and-fill volume calculation is often essential. For agricultural surveys, a vegetation health index derived from near-infrared imagery may be more relevant. Process these derivative layers now. It is much harder to add them later after you have built the report layout.
A platform such as nationaldroneservices.net provides a single environment for uploading, processing, and visualizing these layers. Using one platform throughout the workflow keeps your data organized and reduces compatibility headaches. You can move from raw upload to finished layer without exporting and reimporting between different tools.
Step Three: Annotate and Measure with Purpose
Now that your base layers are ready, add the annotations that make the report useful. Mark boundaries, structures, areas of interest, and any features that stakeholders will need to reference. Use clear labels. If you add measurements such as distances, areas, or volumes, include the measurement method and expected accuracy. For example, note whether the volume calculation uses a reference plane or a terrain surface. This level of detail helps technical stakeholders assess the reliability of your numbers.
Create a legend that explains every symbol, color, and layer in the report. Think about the viewing format. Will stakeholders view the report on a large monitor, a tablet, or a printed page? Design your annotation size and contrast for the smallest expected screen. Nothing frustrates a viewer more than illegible text on a map. Use high-contrast colors for lines and markers. Avoid relying on color alone to convey information; add patterns or labels for viewers who may be colorblind.
Step Four: Choose a Shareable Output Format
Not all output formats suit every stakeholder. A PDF is universally readable and works well for printed documents or email attachments. But a PDF flattens interactive layers. If your report includes zoomable maps, clickable points, or togglable layers, consider an interactive web map or a packaged project file that can be opened in free viewing software. Many platforms let you generate both static and interactive reports from the same processed data.
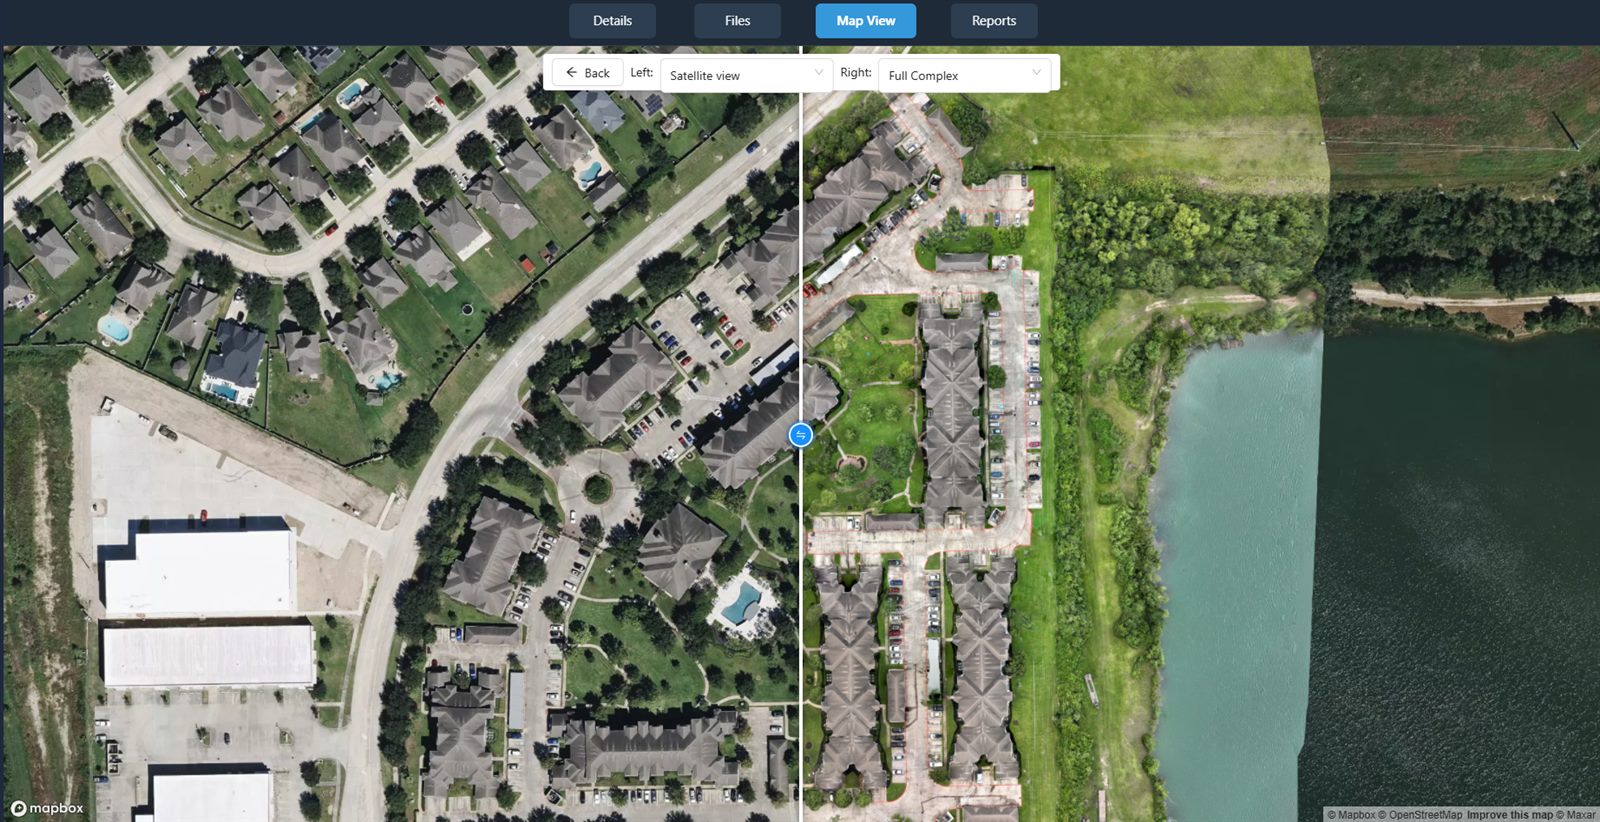
When you create a static report, include key reference information: the flight date, weather conditions, the drone model used, the processing software version, and any coordinate system details. This metadata lets the stakeholder evaluate the report's currency and suitability. For interactive reports, ensure the file size is manageable for your distribution method. Large point clouds or high-resolution orthomosaics may need to be compressed or tiled for smooth browsing. Test the report on a typical user's connection speed and device before sending it out.
Step Five: Distribute with Clear Context
Sending a raw file without explanation leaves room for misinterpretation. Write a brief cover note that tells each stakeholder what they are looking at and what action you recommend. For example, "Attached is the orthomosaic from the January 15 survey of the north parcel. The red polygon shows the area where erosion exceeds the threshold. Please review and advise on remediation before the next inspection." This note turns your report from a data dump into a decision-support tool.
Use a reliable file-sharing method that matches your stakeholder's security requirements. For sensitive infrastructure projects, a password-protected portal may be necessary. For routine updates, a cloud storage link with an expiration date works well. Always confirm receipt. A quick follow-up message a day after sending can catch questions early and prevent delays.
National Drone Services, through its platform, allows you to manage access permissions and share reports directly with stakeholders. The same environment that processes and visualizes the data also controls who sees what. This reduces the risk of sending the wrong version or sharing sensitive information too broadly. National Drone Services focuses on keeping the entire workflow connected, from capture to collaboration.
Common Pitfalls and How to Avoid Them
One frequent mistake is overloading the report with every possible layer. More information is not always better. A cluttered map confuses the viewer and dilutes the key message. Edit ruthlessly. If a layer does not support the primary decision the stakeholder must make, leave it out. You can always provide supplementary data on request.
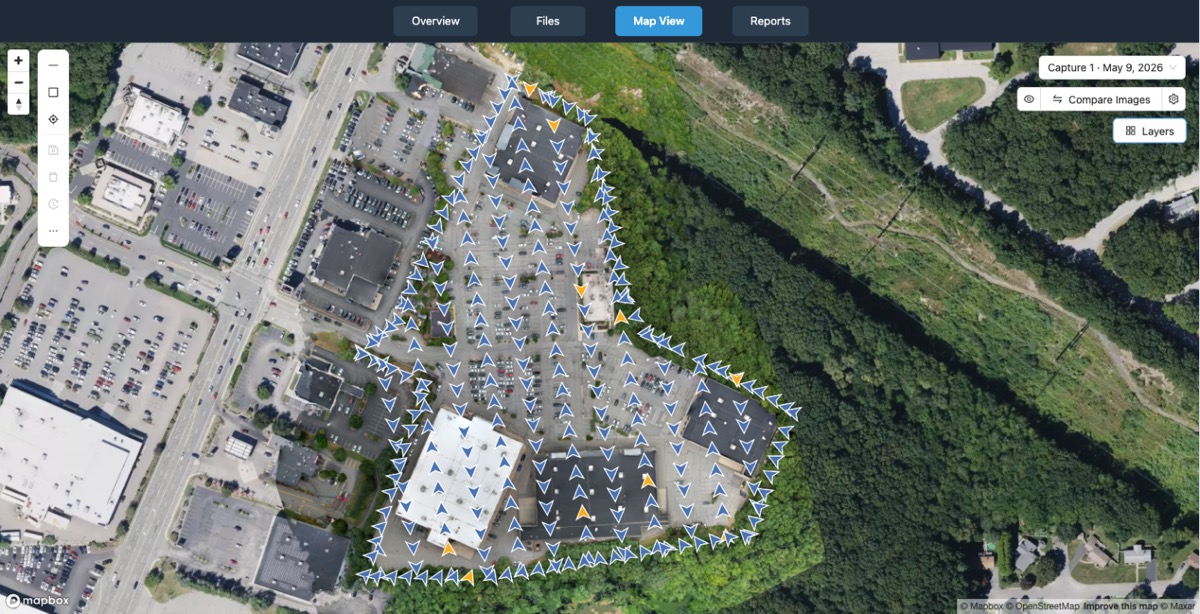
Another pitfall is ignoring file naming and folder structure at the start. A messy project folder leads to broken links in interactive reports and wasted time hunting for source files. Establish a simple system and stick to it. Organizing data is not glamorous, but it is the foundation of a reliable workflow.
Finally, do not assume your stakeholders understand drone data. Explain the basics of what an orthomosaic is and how you derived measurements. A short glossary in the report appendix can prevent confusion. Your goal is to make the report as accessible as possible without dumbing down the technical content. With a little forethought, your aerial reports become powerful tools that drive real decisions.
National Drone Services on social media
 Facebook